We investigate the dynamic effects of customer experience levels on satisfaction in China’s automobile industry. Based on a large-scale sample of 657,300 online reviews, our empirical study produced three meaningful findings. First, higher customer experience levels are associated with a decrease in customer satisfaction. Second, compared with lower-priced cars, satisfaction is higher for higher-priced cars, and it declines at a slower rate. Third, satisfaction with popular cars, which is often lower than that for unpopular cars, de- clines at a faster (slower) rate than satisfaction with unpopular cars when they are higher-priced (lower-priced). Therefore, both price and popularity have important moderating effects on the relationship be- tween satisfaction and customer experience level. We discuss the managerial implications of these results, as well as avenues for future research.
The evaluation of customer satisfaction is an important pillar of customer loyalty (Bolton and Drew, 1991; Oliver, 1980), sales performance (Anderson et al., 1994; Anderson and Sullivan 1993; Oliver and Swan, 1989), and customer relationship management (Bendall-Lyon and Powers, 2002; Bolton, 1998; Bolton, and Lemon, 1999). Improving satisfaction allows companies to promote their products, and the cumulative knowledge of consumer preferences can be used to develop new products. The advent of the Internet has enabled consumers to share their experiences of specific products in online communities. Online reviews provide insights on satisfaction to both companies and consumers, as the ratings or contents often indicate the degree of perceived satisfaction with the product (Moon et al., 2010). For companies, these online reviews are a new effective element of marketing communication mix (Wang et al., 2015). For consumers, this information is one of the most important factors influencing purchasing decisions (Chen et al., 2011; Chevalier and Mayzline, 2006; Zhu and Zhang, 2010), and according to an eMarketer report (2013), approximately 92% of consumers evaluate related online reviews before shopping. Therefore, understanding more characteristics of the customer satisfaction through online reviews is a meaningful issue for both companies and consumers.
Given the importance of online reviews, in this study, we attempt to investigate the dynamic effects of customer experience levels on durable product satisfaction. Two related points warrant further explanation to provide a foundation for our study. First, we must clearly define the term customer experience level. The customer experience (or rather consumer experience) has been used widely in the managerial literature to generally express marketing-related experiences (Schmitt, 1999). Related studies may involve discussions of general frameworks of experience and the experience process (Schmitt and Zarantonello, 2013). However, in this study, customer experience level is regarded as a comprehensive assessment indicator for measuring a customer’s post-purchase usage levels, including duration of use or number or uses. Specifically, a higher customer experience level indicates that the customer has used the product for a longer time.
Second, dynamic effects of experience level are critical only for specific types of products, primarily durable products, which do not wear out quickly and provide utility over time, rather than being completely consumed in one use. The continued use of these durable products over time implies that the customer experience level also changes over time. By contrast, for a general experience product such as a movie, the use time or use frequency is relatively small for most people, and thus the consumer experience level often involves a relatively short period of time. Although changes in customer experience levels are possible in a short time, they are difficult to observe and may be limited in magnitude. Thus, durable products provide a more appropriate context for empirical studies exploring the dynamic effects of experience on satisfaction.
China’s automobile market is a representative and meaningful research context based on the representativeness of automobiles as a typical durable product and the size of the Chinese market. According to IHS Markit (www.ihsmarkit.com), a leading source of market-wide insight on the automotive industry, the aver- age age of light cars and trucks in the U.S. was 11.6 years in 2016, consistent with the main feature of durable products—sustainable use for a long period of time. Moreover, according to a 2016 VDA (2016) report on global car sales, China was the world’s largest and fastest-growing single-country automobile market in 2016, with annual sales reaching a new high of 23,693,400 cars, an increase of 18% over the prior year. In addition, reviews by the online automobile community are likely to play an important role in purchase decisions because customers tend to perform more external searches when planning to buy durable products such as automobiles (Klein, 1998). However, each published review is associated with different consumer experience levels. Thus, identifying the magnitude and direction of impact of the customer experience level on the evaluation of satisfaction will help people further understand changes in satisfaction. Maintaining satisfaction is a key factor for retaining customers and increasing profits (Mittal et al., 2001), and thus correctly interpreting the meaning of satisfaction at different customer experience levels should be prioritized.
Several studies have indicated that satisfaction diminishes with post-purchase time1 in the automobile industry (Mittal et al., 1999; Mittal et al., 2001; Richins and Bloch, 1991). Moreover, Slotegraaf and Inman (2004) show that, during the manufacturer warranty period, satisfaction with resolvable attributes (e.g., defective or faulty parts) declines at a faster rate than satisfaction with irresolvable attributes (e.g., gas mileage or driver’s seat comfort). Compared with the prior literature, the main innovations of this study can be categorized according to the following three aspects. First, measuring the customer experience level, an important driving factor for satisfaction (Bolton and Lemon, 1999), remains challenging. For example, two customers who buy cars at the same time but drive with different frequencies (every day versus once per week) will have the same customer experience level with respect to time but different usage levels. Even if the number of uses can be observed, but amount of time or level of involvement associated with use is difficult to assess. Therefore, most previous studies have focused only on the time component of the customer experience level. Our study is the first to provide another possible measure of the customer experience level of the number of uses, the customer experience level of distance, which considers the number of kilometers driven as a proxy variable for usage levels. For other durable products, researchers could identify similar measures of usage levels as alternatives to use time, such as the total power consumption of household appliances.
Second, to explore the influence of customer experience levels, most investigations of satisfaction employ questionnaires (Mittal et al., 1999; Mittal et al., 2001; Richins and Bloch, 1991; Slotegraaf and Inman, 2004). As an alternative to a questionnaire, we collected longitudinal data from an online publicly accessible community. Specifically, we obtained online reviews from Autohome, the most popular online automobile community in China. As of 2016, Autohome featured nearly one million reviews, which include not only review ratings and posted dates but also purchase dates and kilometers driven. Thus, changes in post-purchase satisfaction can be analyzed in an automated and systematic fashion on a large scale. More importantly, online review ratings can be regarded as a form of electronic word-of-mouth2 (eWOM). Com- pared to traditional word-of-mouth, eWOM is more accessible and has a faster diffusion rate, lower search cost, and greater impact (Chen et al., 2011; Chevalier and Mayzlin, 2006; Dellarocas et al., 2007; Duan et al., 2008;
Park et al., 2012). Accordingly, switching our investigation from offline to online may increase the relevance of the management implications of our findings. Since both companies and consumers are free to evaluate satisfaction (or eWOM) without constraint by geographical scope and time, rapid adjustments of marketing strategies or purchase decisions become viable. Moreover, our findings enrich and inspire the eWOM literature. A principle research area in eWOM is its generation/transmission, including self-enhancement, consumer psychographics, product/retailer performance, and altruism/concern for others (Berger, 2014; King et al, 2014). Our study bridges a gap in the literature by investigating whether customer experience levels affect the valence of eWOM for durable products.
Third, this study discusses the effects of two moderator variables, price and popularity. The price of a product is often considered an important indicator of quality (Dodds et al., 1991), and perceived quality is a critical factor explaining satisfaction (Anderson and Sullivan, 1993; Anderson and Fornell, 1994; Fornell et al., 1996). Thus, we infer that a relatively high product price will be associated with a slower decline in satisfaction; by contrast, if the product price is relatively low, satisfaction will decline more rapidly. The other potential moderator variable, popularity, also generally signals higher quality (Caminal and Vives, 1996; Hellofs and Jacobson, 1999) and thus would have the same impact as price. However, it is occasionally optimal for consumers to ignore individual needs and follow the crowd, in a form of herd behavior (Banerjee, 1992; Bikhchandani et al., 1992). Following the views of herd theory, consumers are often influenced by the majority and follow the minds or behaviors of the public. Accordingly, consumers may choose a popular product that does not meet their needs or is not suitable for the situation at that time, resulting in disappointment and dissatisfaction (Parthasarathy and Bhattacherjee, 1998). As a consequence, herd behavior would result in a faster decline of satisfaction for popular products compared to non-popular ones. Therefore, the moderating effect of popularity is more complicated than that of price. We provide detailed analyses of the moderating effects of both price and popularity in our study.
The rest of this paper is organized as follows. In the next part, we introduce the theoretical framework and develop the hypotheses. The third section describes the research context, the measurement of the variables and the data source. Next, we describe our model and empirical results. Finally, we discuss the research findings, managerial implications, and future research directions and limitations.
This study investigates the dynamic effects of customer experience levels on satisfaction with durable products, such as automobiles, appliances, and furniture. These types of products are not usually purchased frequently since they can be used for a long time. Thus, in terms of durable products, long-term information about post-purchase satisfaction can be generated, allowing us to observe changes in satisfaction with different customer experience levels. Research hypotheses are constructed based on the related literature, including expectation-confirmation theory, adaptation level theory, price-quality inference, and herd theory.
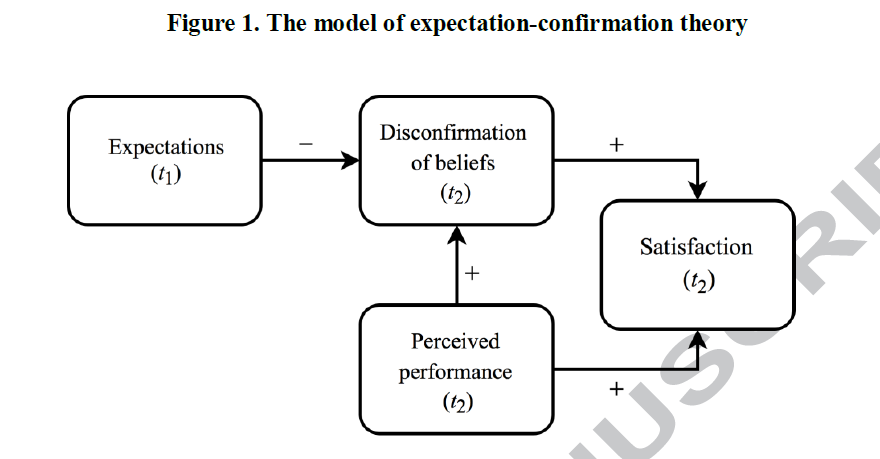
Expectation-confirmation theory (ECT), alternatively called the disconfirmation of expectations theory, is a cognitive theory that is widely used in the Marketing field to study post-purchase or post-adoption satisfaction (Anderson and Sullivan, 1993; Cadotte et al., 1987; Dabholkar et al., 2000; Oliver, 1980; 1993). ECT seeks to explain satisfaction as a function of expectations, perceived performance, and disconfirmation of beliefs. Figure 1 shows the major constructs and relationships in ECT. Consumers form satisfaction according to the following process.
First, consumers always have initial expectations of a specific product when the purchasing decision is made at time t1. Second, after a period of consumption (from t1 to t2), they form the perceived performance, a type of post-purchase perception, based on their feelings and the performance of the product at time t2. Based on the perceived performance, the disconfirmation of beliefs can be evaluated or judged by comparison with the original expectations (Fournier and Mick, 1999; Richins and Bloch, 1991). In other words, the disconfirmation of beliefs can be determined from the difference between perceived performance and expectations. Intuitively, higher perceived performance or lower expectation induces higher disconfirmation of belief. Finally, in the interim or at time t2, satisfaction is formed by the disconfirmation of beliefs and perceived performance (Oliver and Swan, 1989). In general, both have positive effects on satisfaction (Anderson and Sul- livan, 1993).
The importance of satisfaction warrants further discussion. Several studies have shown that satisfaction has a positive effect on repurchase intention (Homburg et al., 2005; Seiders et al., 2005). A similar phenomenon occurs in the retail context. Seiders et al. (2005) find that higher customer satisfaction with a vendor reduces the likelihood of transfer to other vendors and reinforces loyalty to the existing vendor. In other words, a positive psychological feeling is critical to a customer’s behavioral decision because customers of- ten use past experience as the foundation for making future decisions (Chiou, 2004). As noted above, enhancing customer satisfaction is crucial for retaining customers and improving profitability (Mittal et al., 2001). Although satisfaction can be measured in a number of ways, product ratings from online reviews are regarded as a good proxy variable in recent empirical studies (Moon et al., 2010).
According to ECT, before making purchasing decisions, consumers typically collect and evaluate product information from friends or mass media and then form their own expectations. In other words, the expectation is pre-acceptance and thus is unrelated to customer experience levels. By contrast, the post-purchase perceived performance is influenced by first-hand experience, which always varies depending on the customer experience level. For experience products, this issue is relatively insignificant because such products are usually used only once and for a short period of time. Exploring the relationship between customer experience levels and perceived performance is more meaningful for durable products because consumers usually use these products frequently and for a longer period of time.
We first recognize that perceived performance consists of objective and subjective (or emotional) components. The latter is similar to the influence of affect in the literature (Oliver, 1993; Homburg et al., 2005). For example, in the automobile context, the objective perceived performance might involve the product’s effectiveness (e.g., the level of fuel consumption or failure rate), whereas the subjective perceived performance is related to personal feelings (e.g., happiness or disgust). Because customers usually collect extensive information about a durable product before making a purchase decision (Klein, 1998), they know most of the characteristics of the product, suggesting that a higher customer experience level might not change their objective perceived performance. Even if the consumer bought the product without collecting information, she would have a general understanding of the product’s features after a few days of use. Therefore, unless an unexpected failure occurs, the impact of customer experience levels on objective perceived performance is likely to be limited. However, the formation of subjective perceived performance is more complex. According to the adaptation level theory proposed by Helson (1964), an individual’s subjective feeling regarding particular classes of stimuli is determined by his/her recollections of past judgments of similar stimuli. Based on the principle of psychological and physical adaptation, the longer customers face one stimulus, the less sensitive they become. When a consumer buys a specific product, she may be very fond of it. Nevertheless, as the customer experience level increases, this feeling will gradually diminish, which will result in lower perceived performance. In addition, as shown in Figure 1, perceived performance is posited to positively in- fluence satisfaction not only directly but also indirectly via a meditational relationship through disconfirmation of beliefs. Thus, we offer:
Several empirical studies have investigated changes in satisfaction over time after a consumer purchases a durable product. To collect assessments of satisfaction, researchers track the same consumer and conduct questionnaires at different points in time (Richins and Bloch, 1991), a strict approach for collecting relevant data if time and cost are no consideration. Alternatively, a sample can be collected by directly grouping customers based on the time of purchase. For instance, during the three-year warranty period, Slotegraaf and Inman (2004) divide customers based on three time intervals: ownership for 9 months, 21 months, or 33 months. They then capture satisfaction from each interval and find that the product attribute satisfaction de- clines over time. Our study is similar to this second category and further explores whether satisfaction changes depending on customer experience level, as measured by the customer experience level of time (ELT) and the customer experience level of distance (ELD). Since both ELT and ELD can be observed from the online automobile community, these sample data can be used to support the verification of the hypothesis.
We first investigate the main effect of price on satisfaction and then explore its moderating effect on the relationship between satisfaction and customer experience level. Zeithaml (1988) defined price as “what is given up or sacrificed to obtain a product” (p. 10). In general, price can be distinguished as the objective price and perceived price (Jacoby and Olson, 1977); the objective price refers to the real price paid by the consumer, and the perceived price refers to the price as encoded by the customer. Our data are the actual purchase prices provided by reviewers and thus represent the objective price. In the price-quality inference, consumers frequently use price as an indicator of product quality and believe that price and quality are highly correlated (Lichtenstein and Burton, 1989). In other words, a higher-priced product is believed to possess higher quality than a lower-priced product (Lichtenstein et al., 1993). In addition, the product quality level is usually reflected in the consumer’s objective perceived performance, and there is a positive correlation be- tween these two variables. For example, a lower level of fuel consumption implies higher quality and suggests that the automobile will have greater objective perceived performance. According to ECT, this greater objective perceived performance will induce higher satisfaction. Moreover, abundant academic research supports product quality as an important determinant of satisfaction (Anderson and Sullivan, 1993; Anderson and Fornell, 1994; Fornell et al., 1996). Therefore, a higher-priced product is more likely to induce higher satisfaction among customers.
Because consumers know most of the features of the durable products they buy, the effects of customer experience level on objective perceived performance might be limited. However, malfunctions would surely reduce objective perceived performance. In general, a product of lower quality (or lower price) often has greater variability and, accordingly, a greater possibility of malfunction. In other words, the quality level of a product reflects the probability of failure. When customers use a product for a long time or a greater number of times, failures, whether serious or minor, will undoubtedly lead to a decrease in customer satisfaction.
Therefore, we believe that price has a moderating effect on the relationship between customer experience level and satisfaction. Specifically, a higher price will slow the rate of decline of satisfaction with a product due to better quality or fewer malfunctions; by contrast, lower-priced products are more likely to malfunction, and thus satisfaction will decline more quickly. Thus, we propose the following hypothesis:
We next discuss the effects of popularity on satisfaction. Similar to price, greater popularity signals higher product quality (Bolton et al., 2004; Clemons et al., 2006; Pavlou and Gefen, 2004; Zhu and Zhang, 2010), which implies that popularity might have a positive impact on satisfaction. However, from the psychological perspective, it may be optimal for customers to ignore personal needs or product quality and to follow the crowd (Banerjee, 1992; Bikhchandani et al., 1992). This irrational decision-making is a typical herd behavior. Herd behavior creates excessively high expectations, leading to greater disconfirmation, and thus plays a large role in negative outcomes (Josephs et al., 1992; Parthasarathy and Bhattacherjee, 1998; Rao et al., 2001; Zeelenberga and Beattieb, 1997). Therefore, popularity affects satisfaction through both objective and subjective perceived performance; that is, product quality has a positive effect on satisfaction according to the former, whereas herd behavior has a negative effect on satisfaction according to the latter.
Finally, we investigate the moderating effects of popularity. In general, greater popularity of a product indicates a certain level of quality, which would reduce the rate of decline of satisfaction. By contrast, the selection of popular products solely due to herd behavior would exacerbate the declining rate of satisfaction. Specifically, when customers choose popular products by following the opinions of others rather than as a thoughtful decision, they are more likely to feel ex post regret once they understand everything about the product. Thus, herd behavior would result in a decline of subjective perceived performance across more customer experience levels. Combining both effects of popularity, we believe that when a product has a certain level of quality (a higher-priced product), popularity will exacerbate the declining rate of satisfaction due to herd behavior. By contrast, when product quality is in doubt (a lower-priced product), popularity will slow the declining rate of satisfaction due to quality. Therefore, we offer:
This study explores changes in customer satisfaction with consumer experience levels in China’s auto- mobile industry for three reasons. First, as noted in previous sections, automobiles are durable products, and people use their cars for a long time. Therefore, data on satisfaction, which changes with different consumer experience levels of time (or distance), can be generated. Second, China is the world’s largest automobile producer and market, with total sales of new automobiles reaching 23.7 million in 2016. We collected data from Autohome (www.autohome.com.cn), the largest online automobile community in China, to ensure the representativeness of our research sample. Finally, from the consumer’s point of view, the risk of purchasing an automobile is higher than that for general products due to the complexity of its attributes and relatively higher prices. People often conduct more careful evaluations of various attributes of automobiles. Thus, automobiles are among the most popular products for which consumers search for external data (Klein, 1998), implying that satisfaction (or eWOM) is an important factor in sales performance in the automobile industry.
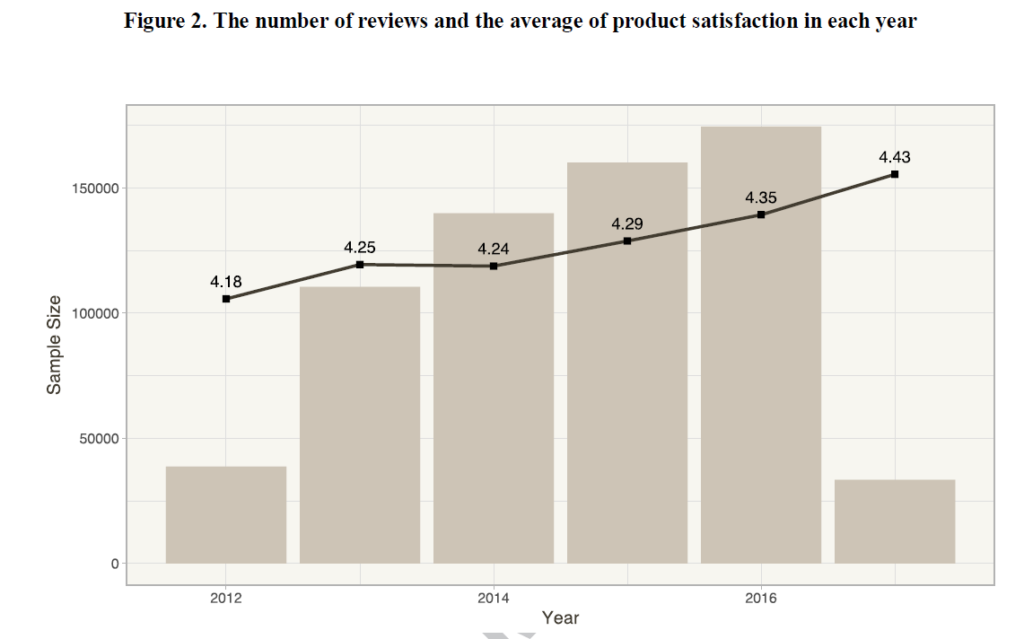
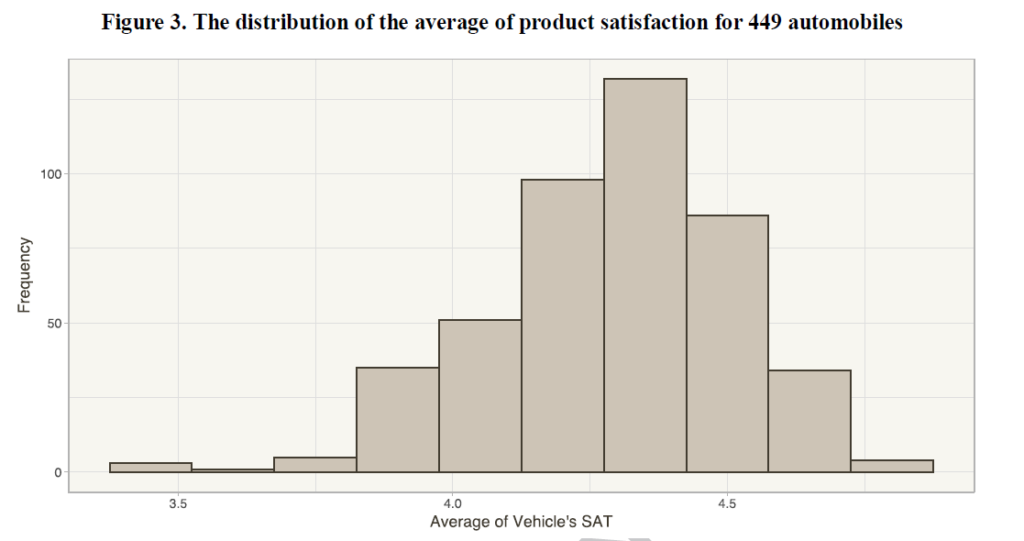
Autohome was established in 2005 and was listed on the New York Stock Exchange (NYSE) in 2013. As of December 2016, the membership of this website was approximately 24.7 million, with approximately 950 thousand relevant consumer reviews, and the average staying time of users was 12.8 minutes. Our sample was automatically extracted from Autohome using web crawler technology in April 2017. The original dataset contained 740,993 reviews from September 2012 to March 2017. In our empirical study, we set ELT to no more than 60 months and ELD to less than 200 thousand kilometers. Finally, after deleting incomplete data, our sample size of reviews was 657,300. Figure 2 shows that both the number of reviews (volume) and average customer satisfaction (average review ratings) increase with time. This profile indicates that our sample is reasonably distributed in each year. However, because the most recent year clearly exhibits higher satisfaction, we control “year” to avoid interference with our research results. A histogram of each car’s average customer satisfaction is presented in Figure 3. The histogram shows a roughly bell-shaped distribution, with satisfaction falling between 3.4 and 4.8.
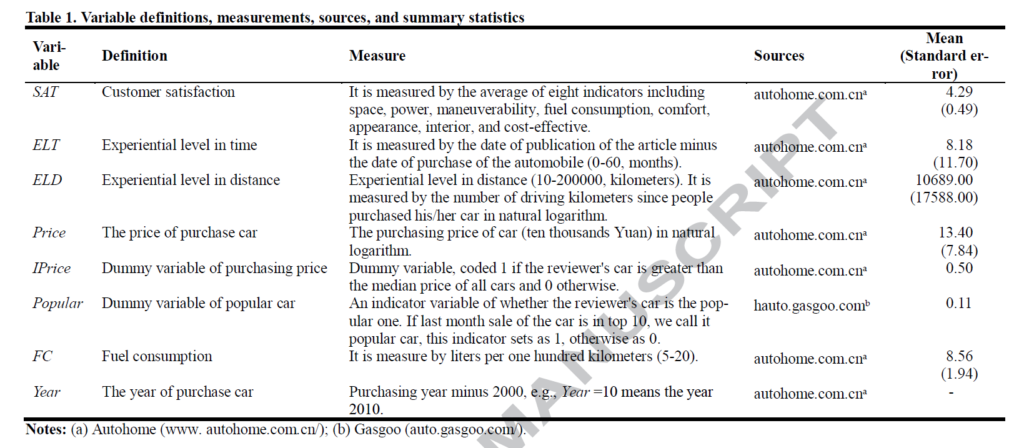
Customer satisfaction. SAT refers to the favorability of the product after the consumer purchases the product. The online review rating can be regarded as a proxy variable of SAT, with higher scores indicating higher satisfaction with the product (Moon et al., 2010). Each review presented in Autohome contains eight evaluations of the automobile’s attributes (i.e., space, power, maneuverability, fuel consumption, comfort, appearance, interior, and cost-effective), and SAT ranges from 1 to 5 (1 star indicates very dissatisfied, and 5 stars indicates very satisfied). In this study, SAT is calculated by averaging the scores for the eight attributes to represent the overall satisfaction with the product.
Customer experience level. We use two proxy variables to measure customer experience levels. One is the customer experience level of time (ELT), which is measured by the number of months between the published online evaluation date and the date of purchase of the car. A larger ELT indicates a longer period of assessment of the product and, consequently, a higher customer experience level. Specifically, ELT = 0 indicates that the reviewer purchased the automobile and posted a review in the same month. A value of ELT larger than zero indicates that the reviewer completed a review after ELT months. The other variable, which reflects use frequency, is the customer experience level of distance (ELD), which is measured by the number of kilometers driven since purchase (Bolton and Lemon, 1999). Like ELT, a larger ELD indicates a higher customer experience level because the user has driven for a longer distance. Both ELT and ELD can be observed in Autohome. Because the distribution of the original ELD values is highly positively skewed, in our empirical studies, we directly use the natural log-transformed values of ELD.
Price. Because vehicle models and generations can vary greatly, it is not appropriate to use the company’s suggested retail price for each automobile. Moreover, vehicle dealers often introduce a variety of discount programs, resulting in different purchase prices for the same type of car. Therefore, in this study, we use the prices from Autohome. Each review includes the exact purchase price. Because the observed prices are right skewed, we use the natural log-transformed values of the prices (Li and Hitt, 2008; Zhu and Zhang, 2010). Furthermore, to facilitate the explanation of the moderating effects in the regression analysis, we employ an additional dummy variable, IPrice, which takes a value of 1 if the price is greater than the median price of all cars and 0 otherwise.
Popularity. The popularity of an automobile is a dummy variable. Each review contains both the pur- chase date and posting date. A customer makes a purchasing decision on the buying date and shares his/her opinion on the posting date. In our study, whether a car is popular or non-popular at a specific time is deter- mined by the sales ranking in the previous month based on the purchase date. Specifically, the reviewer’s car is regarded as popular (Popular=1) if sales of this type of car in the previous month were among the top 10 sales rankings and non-popular otherwise (Popular=0). Sales ranking information is obtained from au- to.gasgoo.com. Based on our sample, the total sales of popular cars account for roughly 20% of the total market, and reviews of popular cars account for 11.1% of total reviews. Furthermore, the median prices of popular and non-popular cars are 107 and 118 thousand Chinese Yuan, respectively.
Control variables. Two control variables are considered in our study. The first, fuel consumption (FC), is an important factor in car evaluations and is measured by liters per one hundred kilometers. In addition, as shown in Figure 2, since the average SAT increases over time, we control the year to avoid some inference biases. Specifically, the second control variable is the reviewer’s purchase year (Year), which is measured as the purchase year minus 2000; for example, Year = 10 indicates that the car was purchased in the year 2010. Table 1 presents the names, definitions, measures, sources, and summary statistics for all variables.
To investigate the purely dynamic effect of ELT on customer satisfaction, we directly group all reviews by ELT and then calculate the average SAT of each group. We plot the relationship between ELT and average SAT in Figure 4 (a). SAT obviously decreases with ELT. A similar declining trend of SAT is observed when the reviews are grouped by ELD, as shown in Figure 4 (b). Therefore, on average, higher customer experience levels, including ELT and ELD, are associated with lower satisfaction. Although our research sample is from an online automobile community rather than a long-term questionnaire, this result is consistent with those of Richins and Bloch (1991) and Slotegraaf and Inman (2004) and therefore verifies the robustness of previous work, even after more than 25 years or in another country’s automobile industry. Compared with the questionnaires used in previous studies, the online ratings used in this study are very representative. Specifically, our sample includes nearly all types of cars sold in China and reviewers from approximately 360 cities, of which at least 200 cities have more than 570 evaluations each. In addition, collecting samples from online communities is more efficient with respect to time and cost than a questionnaire. To clearly explain our findings, we first focus on the effects of ELT and discuss outcomes related to ELD later.
To formally verify Hypoethesis 1, we estimate the following regression model:
𝑆𝐴𝑇i = 𝛽0 + 𝛽1(𝐸𝐿𝑇i) + si (1)
and
𝑆𝐴𝑇i = 𝛽0 + 𝛽1(𝐸𝐿𝑇i) + 𝛽2(𝐹𝐶i) + 𝛽3(𝑌𝑒𝑎𝑟i) + si. (2)
The variables are defined in Table 1, and the subscript i indicates the ith review. We report the estimated results in Table 2. In Model (1), the coefficient 𝛽1 is significantly negative (𝛽1 = −0.0108, 𝑝 < 0.001), implying that satisfaction decreases as ELT increases (Richins and Bloch, 1991). We then add two control variables, FC and Year, in Model (2). We find that FC has a negative effect on SAT (𝛽2 = −0.0144, 𝑝 < 0.001), indicating that a higher level of fuel consumption decreases SAT. As shown in Figure 2, SAT in- creases with year, and thus it is reasonable that the other control variable, Year, has a positive effect on satisfaction (𝛽3 = 0.0242, 𝑝 < 0.001). Even when both control variables are considered in Model (2), the coefficient 𝛽1 remains significantly negative (𝛽1 = −0.0084, 𝑝 < 0.001). Based on the above empirical evidence, the Customer’s Satisfaction and Experience Hypothesis (H1) is supported.
To discuss the main effects of the two moderating variables, price and popularity, we first consider the following two regression models:
𝑆𝐴𝑇i = 𝛽0 + 𝛽1(𝐸𝐿𝑇i) + 𝛽2(𝐹𝐶i) + 𝛽3(𝑌𝑒𝑎𝑟i) + 𝛽4(𝐼𝑃𝑟i𝑐𝑒i) + si (3)
and
𝑆𝐴𝑇i = 𝛽0 + 𝛽1(𝐸𝐿𝑇i) + 𝛽2(𝐹𝐶i) + 𝛽3(𝑌𝑒𝑎𝑟i) + 𝛽5(𝑃𝑜𝑝𝑢𝑙𝑎𝑟i) + si (4)
where IPrice and Popular are dummy variables as denoted in Table 1 and the subscript i expresses the ith review data. The estimated results are presented in Table 3. As shown in Model (3), since 𝛽4 = 0.1568 (𝑝 < 0.001), the effect of price on satisfaction is significantly positive. In other words, higher-priced cars tend to make customers feel more satisfied, possibly because their quality is indeed better than that of lower-priced cars. Model (4) examines the main effect of Popular. The results in Table 3 indicate a significantly negative effect of Popular on SAT (𝛽5 = −0.0789, 𝑝 < 0.001). This outcome may be due to herd behavior. Once the consumer begins to use the car, their feelings may differ greatly from their original expectations, and this gap will reduce their satisfaction. To test the robustness of both models, we first use the natural logarithm of Price rather than IPrice in Model (3). In addition, we further define Popular20 using the top 20 automobiles by sales as the criterion instead of Popular in Model (4). Tables A1 and A2 in the Appendix show the estimated regression results, which do not differ significantly from the results for the original models.
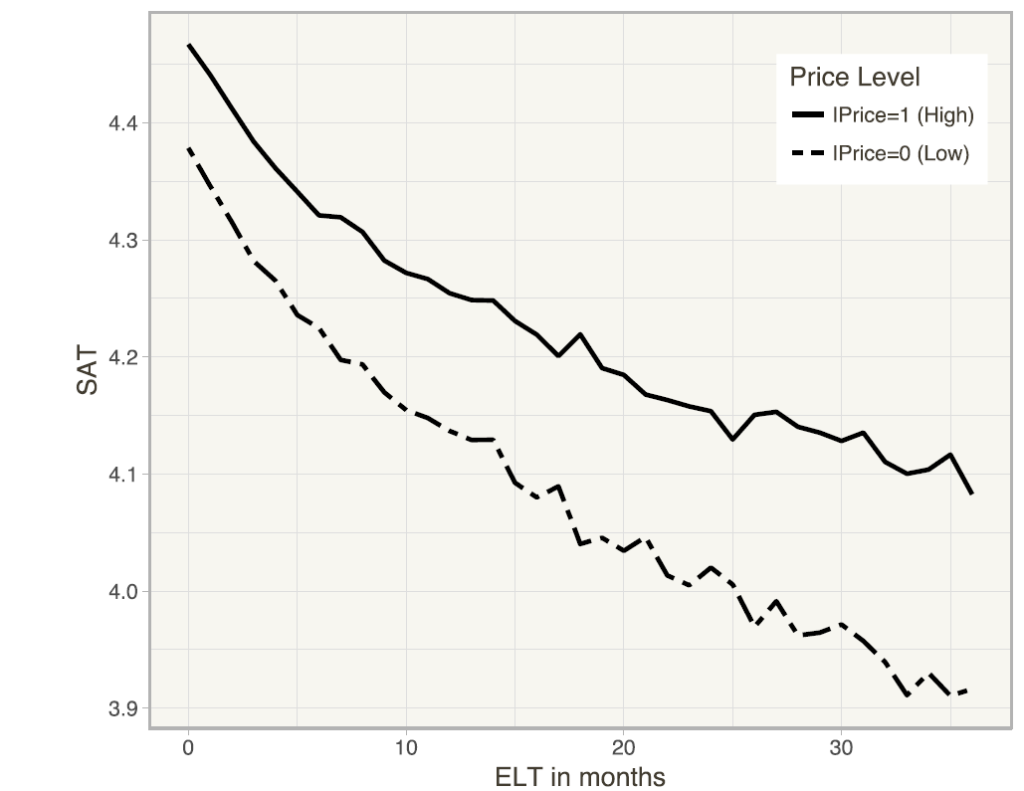
In addition to regression analysis, following a similar approach as in Figure 4, we plot Figures 5 and 6 to explore the effects of price and popularity, respectively. In Figure 5, the solid (dotted) line represents the average SAT of higher-priced (lower-priced) cars. Higher ELT accompanies lower SAT, regardless of car price. Moreover, the average SAT of higher-priced cars is always larger than that of lower-priced cars, consistent with the results of Model (3). The effect of popularity on SAT is shown in Figure 6, where solid and dashed lines correspond to popular and non-popular cars, respectively. Regardless of the value of ELT, the dashed line is always above the solid line, verifying the effect of Popular on SAT is negative.
A moderating effect in regression analysis is characterized statistically as an interaction that affects the strength or even direction of the relationship between the dependent (SAT) and independent (ELT) variables. Figure 5 provides a brief overview of the moderating effect of IPrice by directly comparing the slopes of the solid and dashed lines. As ELT increases, the rate of decline of SAT is obviously slower for higher-priced cars than for lower-priced cars. In other words, the strength of the relationship between SAT and ELT is in- deed affected by price. Similarly, we attempt to observe the moderating effect of Popular in Figure 6. How- ever, the rates of decline of SAT are slightly different for popular and non-popular cars, and we will explore the moderating effect of Popular further in the following discussions.
Considering a three-way interaction among ELT, IPrice, and Popular, the regression equation with three interaction terms is as follows:
𝑆𝐴𝑇i = 𝛽0 + 𝛽1(𝐸𝐿𝑇i) + 𝛽2(𝐹𝐶i) + 𝛽3(𝑌𝑒𝑎𝑟i) + 𝛽4(𝐼𝑃𝑟i𝑐𝑒i) + 𝛽5(𝑃𝑜𝑝𝑢𝑙𝑎𝑟i)
+ 𝛽6(𝐸𝐿𝑇i × 𝐼𝑃𝑟i𝑐𝑒i) + 𝛽7(𝐸𝐿𝑇i × 𝑃𝑜𝑝𝑢𝑙𝑎𝑟i) + 𝛽8(𝐼𝑃𝑟i𝑐𝑒i × 𝑃𝑜𝑝𝑢𝑙𝑎𝑟i)
+ 𝛽9(𝐸𝐿𝑇i × 𝐼𝑃𝑟i𝑐𝑒i × 𝑃𝑜𝑝𝑢𝑙𝑎𝑟i) + 𝜀i
(5)
where IPrice and Popular are dummy variables defined in Table 1, and the subscript i expresses the ith re- view. The estimated results are shown in Model (5) of Table 3. Since this study focuses on the dynamic effects of ELT on SAT, we only discuss the coefficients related to ELT. When exploring the moderating effects of IPrice and Popular, four cases should be discussed:
In Case (a), the rate of change of SAT with ELT is equal to β1 (-0.0098); so SAT will decrease by 0.0098 when ELT increases by one unit. For the other three, Cases (b), (c), and (d), the rates of change of SAT with ELT are equal to β1 + β6 (-0.0075), β1 + β7 (-0.0089), and β1 + β6 + β7 + β9 (-0.0080), respectively. The corresponding interaction plot is shown in Figure 7, which indicates that the declining rate is slower in Case (b) than in the other cases. To investigate the differences in the declining rate among the four cases, we further conduct a formal statistical test.
To examine the strength of the moderating effects among the four cases, our data are separated into four groups, and then four regression equations, one for each group, are estimated with ELT regressed on SAT. The estimated coefficients of ETL are termed the simple slopes. In this study, the simple slopes difference test is used to compare the moderating effects among the four cases (Robinson et al., 2013). All results are reported in Table 4. The differences in slope between the 6 compared pairs: (a, b), (a, c), (a, d), (b, c), (b, d), and (c, d), are significantly different from 0, which implies that the strengths of the moderating effects are significantly different among the four cases.
The moderating effects of IPrice are very clear. According to the evidence in pairs (a, b) and (c, d), the rate of decrease in SAT with ELT is slower for higher-priced cars than for lower-priced cars, no matter if Popular = 0 or 1. Based on this evidence, the Moderation by Product Price Hypothesis (H2) is supported. The moderating effects of Popular are more complicated. Given IPrice = 1, more popular cars have faster declining rates of SAT with ELT than non-popular ones, as shown in the results for pair (b, d). However, given IPrice = 0, more popular cars have slower declining rates of SAT with ELT than non-popular cars, as shown in the results for pair (a, c). Thus, the Moderation by Product Popularity Hypothesis (H3) is supported. In summary, according to the estimated coefficients in Model (5) or the simple slopes difference test, the declining rate of SAT with ELT increases from slower to faster in the order (b), (d), (c), and (a). In other words, the moderating effects of price and popularity on the relationship between ELT and SAT are obvious.
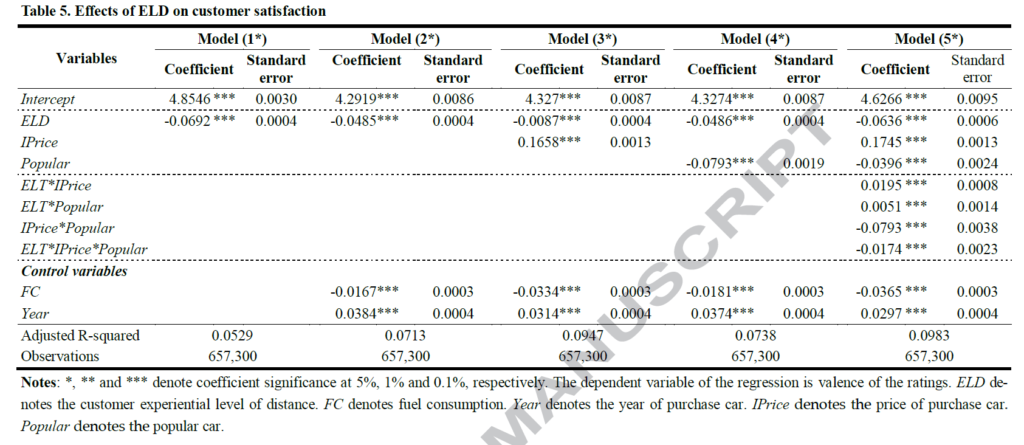
To ensure the robustness of this research, we further explore the effects of ELD. We process the same models described previously, with Models (1)-(5), but use ELD instead of ELT. The corresponding results are reported in Table 5. For example, Model (2*) shows that ELD also has a significantly negative effect on SAT (𝛽1 = −0.0485, 𝑝 < 0.001). Both the main and moderating effects of IPrice and Popular are consistent with the results for ELT. The simple slopes difference test is also repeated for ELD, and the corresponding results are reported in Table 6. Although the difference in coefficients is not significant for the pair (c, d), overall, the empirical results are quite robust.
Two robust tests are provided in this subsection. As shown in Figure 2, there is a significant difference in SAT with year. We first verify whether the declining trend of satisfaction is robust in different years. We select and group reviews by the purchase years of 2012, 2013 and 2014. For each group, we plot the changes in SAT in Figure 8. Due to the restriction of data availability, the range of ELT is between 0 and 24 months. The declining trend of satisfaction is similar in each year. Moreover, as defined in Table 1, SAT is derived from the average of eight indicators: space, power, maneuverability, fuel consumption, comfort, appearance, interior, and cost-effective. The scores for these indicators could be regarded as satisfaction with the automobile’s attributes. We further explore the dynamic effects of ELT on satisfaction with these automobile attributes in Figure 9. The declining trend of satisfaction for each automobile attribute is clearly similar to that in Figure 4. In summary, this empirical evidence further supports the Customer’s Satisfaction and Experience Hypothesis (H1).
Customer satisfaction has always been an important basis of a company’s profits. Therefore, maintaining and improving satisfaction are crucial concerns among scholars and managers. However, most previous studies have focused on cross-sectional or short-period investigations, with far fewer studies related to long-term customer experience levels. Our study is the first to use a large number of online reviews to explore the dynamic effects of customer experience levels on durable product satisfaction. Overall, the empirical results indicate that satisfaction decreases as the customer experience level increases. In addition, both price and popularity interfere with the impact of customer experience level on satisfaction. Our findings and their managerial implications are summarized as follows.
The literature has noted that customer satisfaction declines over time (Bendall-Lyon and Powers, 2002; Richins and Bloch, 1991; Slotegraaf and Inman, 2004), and our findings not only verify this phenomenon but also provide new and innovative insights. First, since the usage level of time is an important driving factor for satisfaction (Bolton and Lemon, 1999), we extend the usage level of time to the customer experience lev- el, including ELT and ELD. According to ECT, customer satisfaction is affected by the disconfirmation of beliefs and perceived performance, which is generally a static model that omits the customer experience lev- el. However, higher customer experience levels might reduce perceived performance and, consequently, de- crease customer satisfaction. Our empirical results support that satisfaction declines as the customer experience level increases. In other words, we suggest that the customer experience level is an important determinant of customer satisfaction.
Second, similar previous studies were based mainly on questionnaires, which are more likely to be limited in survey time, geographical scope, and brand type. We collected our study sample of 657,300 from the most popular automobile community in China, and this large sample supports the representativeness of our findings. More importantly, satisfaction as measured by online review ratings can be regarded as a form of eWOM, which is often used as a critical component of marketing communication mix (Moon et al., 2010). Our study is the first to discuss the effects of customer experience levels on eWOM for durable products, and our empirical results suggest that research related to eWOM should consider the influence of customer experience levels.
Third, we find that both price and popularity have significant moderating effects on the relationship between customer experience levels and satisfaction. As the price-quality inference shows that price and quality are highly correlated (Lichtenstein and Burton, 1989), we conclude that higher-priced cars usually have fewer malfunctions, resulting in a slower rate of decline of satisfaction. However, the effects of popularity are more complicated. Specifically, consumers may buy more popular cars due to their quality or due to mindless herd behavior. In the case of lower-priced cars, popularity serves as a type of quality assurance, which induces a slower rate of decline of satisfaction. By contrast, in the case of higher-priced cars, since the quality has reached a certain level, popularity might reflect a type of herd behavior, which induces a faster rate of decline of satisfaction. Our empirical evidence supports the significance of both moderator variables. Therefore, future studies of the dynamic effects of customer experience levels on satisfaction should consider adding both price and popularity to their research models.
Based on the empirical results, we provide some managerial implications for companies, consumers, and review-hosting firms. Companies must pay attention to the phenomenon of declining customer satisfaction, even if such declines are due to human nature. A palliative approach is to encourage customers to post their reviews as soon as possible, although this represents only a short-term solution that does not address the core problem. We believe a fundamental solution should be adopted in which good two-way communication channels are established to help customers solve their problems satisfactorily and quickly. For example, when people buy low-priced, non-popular cars, their satisfaction might decline more quickly. Companies can adopt a discounted or even free malfunction repair service policy to reduce such negative emotions.
Our results can also help consumers further understand the connotation of satisfaction or eWOM before making decisions. When people use online review ratings as the basis for purchasing a product, they should also carefully consider customer experience levels. Although precisely determining satisfaction adjusted for customer experience level is difficult, reading more product reviews with different customer experience levels may help consumers make better purchase decisions. Finally, from the perspective of review-hosting firms, our findings will help managers design and implement systems on their websites for classifying in- formation and sorting big online consumer review data. Specifically, based on demographic characteristics, review-hosting firms usually provide several types of average review ratings, e.g., the averages of various age ranges or the averages of men and women. Such classifications also increase awareness among consumers of the characteristics of post-purchase satisfaction. For durable products, we recommend that review-hosting firms present the average review ratings for various customer experience levels to reveal more valuable information more quickly and with less effort on the part of the consumer.
The limitations of our research also suggest potential directions for future studies in this area. A major advantage of this study is the use of big data collected from the most popular online automobile community in China. However, this data collection approach also represents a limitation of this study. Compared to traditional questionnaires, the acquisition of variables is limited to the design of the existing website. Therefore, demographic variables such as age, gender, and education are impossible to obtain. Shilling attacks are an- other potential limitation (Gunes et al., 2014). Since Autohome is a public platform, both companies and individuals may post fake reviews on the site. Although Autohome has adopted several approaches to prevent this type of attack, for example, reviews can only be posted by formal members who provide a mobile phone number, email, or social media account for verification, an impact of fake reviews on our research sample cannot be avoided.
Our empirical findings suggest three possible directions for future work. First, sentiment analysis using text mining or natural language processing techniques can produce more information and improve business strategies (Fan et al., 2017; Ludwig et al., 2013). Future studies could use sentiment analysis to measure customers’ feelings and investigate how sentiments change based on different customer experience levels. Second, we have shown that our measure of satisfaction is a form of eWOM that is significantly affected by the customer experience level. Thus, for durable products, the addition of the effects of customer experience levels to the eWOM literature warrants further consideration. Finally, we clearly illustrate the phenomenon of declining satisfaction with increasing customer experience level but provide no solution for slowing the rate of decline. By collaborating with review-hosting firms to obtain more data related to consumer characteristics and past behavior records, researchers could investigate strategies for mitigating the rate of decline of satisfaction. In summary, several extended issues related to satisfaction and customer experience levels merit increased attention to improve customer relationship management, assure customer loyalty, and even increase company profit.


Maadico is an international consulting company in Cologne, Germany. This company provides services in different areas for firms so they will be able to interact with each other. But specifically, raising the level of knowledge and technology in various companies and assisting their presence in European markets is an aim for which Maadico has developed … (Read more)