The European Union offers advantages with regards to the exchange of commodities and services.
The present article endeavors to measure the advantages of trade resulting from the European Union (EU) and the Single Market with regard to the trading of goods and services. The study focuses on the impact of the EU on goods trade since 1965 and on services trade since 2000. Notwithstanding, the research does not explore several other factors, including migration, foreign direct investment (FDI), and the euro, albeit these are covered in qualitative terms to provide an overview of the conceivable impact of the EU.
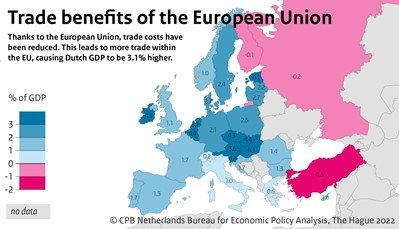
The Netherlands is one of the countries that have profited the most from the rise in EU trade, with long-standing trade gains equivalent to 3.1% of GDP (Figure 1). Being a small open economy, the Netherlands benefits significantly from the low costs related to trade with other EU Member States. Only Ireland, Belgium-Luxembourg, and some nations in Central and Eastern Europe have higher trade gains. The benefits of the European Union are increasing over time for all countries. This is not only due to stronger economic integration and the related reduction in trade costs, but also because the EU is expanding, and there are more Member States to trade with, at very low cost. For the Netherlands, in particular, the Internal Market appears to be quite crucial concerning goods trade, as it explains nearly 80% of the total added value effect of the EU. For other Member States, this is not as significant, and other aspects of the European Union also provide important trade benefits for them.
For countries that are not part of the European Union, the situation is dissimilar. In such cases, the European Union’s impact on trade is often negative, as trade diversion takes place. This happens because trading among EU Member States becomes more cost-effective, which, in turn, makes trade with non-EU countries relatively more expensive. However, this is not true for non-EU countries that are considerably integrated into the European Union, such as Norway, which enjoys significant EU trade benefits. Nonetheless, recent research indicates that these advantages would have been even more substantial had Norway opted to become a full-fledged member of the European Union.
The study at hand does not consider the Brexit scenario, as reliable data is only available until 2017. As a result, the United Kingdom will be considered as a consistent EU member in this article. It is anticipated that the overall advantages of the European Union for the Netherlands will be somewhat reduced due to the Brexit, as the United Kingdom is a significant trading partner for the Netherlands and, overall, the European Union has contracted in size.
It is plausible that the impact of EU trade has been evaluated in a cautious manner. The CPB gravity model has not yet integrated sectoral linkages, which would enable interdependence between sectors to be taken into account. For instance, a rise in demand for automobiles due to lower trade costs benefits not only the Dutch car industry but also Dutch suppliers from other sectors like the metal and rubber industry. The incorporation of sectoral interdependencies in gravity models is still a somewhat recent development, but evidence from academic literature (not exclusively for the Netherlands) indicates that modelling sectoral linkages enhances the estimated trade benefit.
The gravity model, despite its usefulness in estimating trade benefits, fails to consider the dynamic impact that increased productivity resulting from trade may have on economic growth. This is due to the potential increase in international competition between businesses resulting from economic integration and the subsequent reduction in trade costs, which will lead to only the most innovative and productive firms surviving and ultimately increasing productivity at the macro level. This method is no longer in use due to the difficulty in establishing causality between policy and economic growth. In contrast, our study utilized the gravity model, which is a more recently developed method and considered to be one of the best available for estimating trade benefits.
The process of economic integration is not without negative repercussions, despite its many positive trade benefits. Economic integration can result in significant redistributive effects within countries, leading to increased inequality between regions and different segments of the population. Moreover, the advantages of reducing trade costs rapidly decline as trade costs approach zero. An illustration of this is the impact of China’s accession to the World Trade Organization, which resulted in increased unemployment and decreased wages in regions of the United States and Europe where there were more firms competing with Chinese imports. Additionally, economic integration can limit the scope of national policies, as stronger economic integration requires standardization of laws and regulations among member states. This was a key argument presented by Brexit supporters.
However, recent research has demonstrated that, in the Netherlands, exposure to import competition from China has had very limited redistributive effects. More generally, redistributive effects resulting from economic integration are not necessarily negative. Furthermore, the spread of income levels across economies has decreased, and relatively poorer EU economies have grown faster than the wealthier ones, a phenomenon referred to as sigma and beta convergence. Nevertheless, the study did not explore redistributive effects and their consequences.
Figure 1 illustrates that the trade impact of the European Union is indeed favorable, with the Netherlands reaping relatively substantial benefits.
The quantification of the trade advantages brought about by the European Union is the subject of scrutiny.
Our inquiry discerns three stages of economic integration among Member States: (i) unrestricted commerce, (ii) the Internal Market, and (iii) the economic union. To facilitate trade, partner countries may engage in a free trade agreement that entails a reduction or elimination of tariffs and import quotas. If these countries later decide to implement a standardized trade policy towards third countries, a customs union is established. The amalgamation of the first two phases constitutes the economic integration stage of unrestricted commerce. Nonetheless, non-tariff measures (NTMs) may still impede unrestricted commerce in this phase. The second phase of economic integration entails the removal of NTMs on trade and constraints on factor movements (such as labour and capital) among partner countries. This is known as an internal or common market. Additionally, partner countries may elect to cooperate in the domain of economic policy. The corresponding steps of economic integration are encapsulated in the third phase of economic integration: the economic union.
These three phases delineate the most significant developments in the European Union for the trade of goods and services, since its inception over six decades ago. To differentiate the impact of the three phases, we leveraged the fact that different phases were initiated at diverse times in EU history. For each phase, we scrutinized the impact on: trade among EU Member States, trade between EU Member States and non-EU countries, and trade among non-EU countries. These three phases of economic integration within the European Union are, in turn, composed of numerous smaller steps of economic integration such as the customs union and the free trade agreement. Nevertheless, our article design does not enable us to differentiate between all the various intermediate steps.
In our analysis, we gauge the three phases of integration through so-called dummy variables, accounting for gradual implementation. For instance, the dummy variable for the Internal Market indicates which nation joined the Internal Market and when. This approach enables us to discern the full impact of each of the three phases of integration without estimating the effects of each individual law or agreement.
Thus, each dummy is an aggregate variable that encompasses several pertinent regulations and agreements. Given that not every phase of integration is implemented all at once, we also utilize delayed variables that capture the effects of a gradual implementation for each of the three phases. Section 7.1 of the appendix provides a more in-depth discussion of the method employed.
Free trade
The initiation of free trade can be traced back to the 1957 Treaty of Rome, which eradicated trade barriers for goods and services within the European Economic Community (EEC), a forerunner of the European Union. Article 3a of the Treaty of Rome was instrumental in removing tariffs and quantitative restrictions by 1970, thereby promoting the free movement of goods, services, persons, and capital. Prior to this treaty, the EEC countries had imposed high tariffs on imports ranging from 9.5% by the Benelux countries to 18.1% by France. The prime objective of the Treaty of Rome was to achieve the four freedoms, thus leading to an increased number of member states striving for integration in other dimensions in the subsequent decades.
Furthermore, a customs union was established in 1968, which abolished import duties among the six EEC countries, while a common tariff was introduced for imports from third countries. The customs union was expanded with the inclusion of Denmark, Ireland, the United Kingdom, Greece, Spain, and Portugal, thereby elevating the EEC to a total of 12 Member States. Apart from free trade among the EU Member States, the European Union also engages in economic cooperation and trade agreements with nations outside the EU. However, these agreements are usually less extensive than the collaborations among EU Member States, with tariffs not being entirely phased out, and a customs union being non-existent in most cases. Nevertheless, these treaties may cover more than the elimination of tariffs or import quotas. Presently, the European Union has economic cooperation or trade agreements with 78 nations, including prominent ones such as Japan, Mexico, Canada, South Korea, and Turkey, with whom the EU has had a customs union since 1995. Additionally, following Brexit in 2021, a trade and economic cooperation agreement was signed between the European Union and the United Kingdom. Negotiations with 24 other countries have been finalized, with only the signing and/or implementation of the treaties pending. The most significant of these treaties is with the Mercosur countries. Negotiations with other countries such as Australia, China, and New Zealand are ongoing, while talks with the United States were terminated in 2016.
Table 1 presents a comprehensive list of the constituent countries that form the European Union.
| EU | Accession date | Countries | |
| EU-6 | 1958-01-01 | Belgium | Italy |
| Germany | Luxembourg | ||
| France | Netherlands | ||
| EU-9 | 1973-01-01 | Denmark | United Kingdom (withdrawal in 2020) |
| Ireland | |||
| EU-10 | 1981-01-01 | Greece | |
| EU-12 | 1986-01-01 | Portugal | Spain |
| EU-15 | 1995-01-01 | Austria | Sweden |
| Finland | |||
| EU-25 | 2004-05-01 | Cyprus | Lithuania |
| Czech Republic | Malta | ||
| Estonia | Poland | ||
| Hungary | Slovakia | ||
| Latvia | Slovenia | ||
| EU-27 | 2007-01-01 | Bulgaria | Romania |
| EU-28 | 2013-07-01 | Croatia | |
| EU-27 | 2020-01-01 | Exit United Kingdom (31 January 2020)13 | |
The Single Market
In 1985, the European Commission released a White Paper titled ‘Completing the Single Market’ as a precursor to the establishment of the European Single Market. At that time, it had become apparent that the elimination of trade tariffs had failed to result in a fully integrated EU market. The presence of physical borders and national product regulations led to persistent non-tariff measures that hindered the flow of goods. Consequently, the White Paper set forth measures to achieve three objectives: lifting material, technical, and fiscal barriers. The Single European Act of 1986 implemented these measures, and by the end of 1992, the European Single Market became a reality. The European Court of Justice played a critical role in policy harmonization, particularly in enforcing mutual recognition of product standards. However, progress on free movement of services, persons, and capital was slow and continued beyond 1992. The Services Directive of 2006 ensured the freedom of service providers within the European Union to establish themselves or provide services temporarily in another Member State.
The European Economic Area (EEA) was established in 1994, expanding the Single Market to include the European Free Trade Association (EFTA) countries. Austria, Denmark, Norway, Portugal, Sweden, Switzerland, and the United Kingdom founded EFTA in 1960, and Iceland and Finland joined later. The EFTA merged with the Single Market in 1994 to form the EEA. However, EFTA countries have no influence over the regulations and directives that apply to goods or services within the European Single Market, as these are exclusively determined by EU Member States. Countries that joined the EU automatically became part of the Single Market and left EFTA. Switzerland does not participate in the EEA but has access to the European Single Market through separate treaties. Austria, Finland, and Sweden joined the European Union in 1995, expanding the Single Market to include Norway and Iceland.
In the years that followed, the EU expanded further. In 2004, 10 countries (Cyprus, Czech Republic, Estonia, Hungary, Latvia, Lithuania, Malta, Poland, Slovakia, and Slovenia) joined the EU, followed by Romania, Croatia, and Bulgaria in 2007. In early 2020, the United Kingdom withdrew from the European Union (see Table 1).
Economic union
The genesis of the economic union can be traced back to an economic collaboration, which had political objectives. Following the establishment of the European Court of Justice in 1952, the European Coal and Steel Community (ECSC) Treaty of 1951 eliminated trade barriers, such as tariffs, for coal and steel and facilitated cooperation in economic areas, including investments and legislation. Furthermore, by cooperating in heavy industry, the hope was to overcome mistrust between former enemies in the aftermath of the Second World War, thereby preventing a recurrence of the First and Second World Wars.
It was not until the Maastricht Treaty was enforced in 1993 that the European Union was officially established. This Treaty led to the establishment of the European Central Bank and paved the way for the introduction of the euro as the single currency. In addition to economic policies, the Treaty also introduced non-economic policies, such as a common foreign and security policy and cooperation in the fields of justice and security. A year later, in 1994, the free movement of people, goods, services, and capital were established, although the free movement of some services was deferred.
The EU primarily employs three legislative measures to strengthen integration between Member States. These include regulations that are binding and apply directly to all EU Member States, directives that harmonise legislation in the various EU Member States, and decisions that are binding only for the Member State or company to which they are addressed. These measures can be applied in various areas, such as trade legislation, business establishment, product liability, and more. Such cooperation strengthens the integration between EU Member States, which in turn may promote further trade between them.
The gravity model and possible scenarios
In the present study, we utilized a gravity model to investigate the effects on trade under two distinct scenarios. The gravity model, which was founded by distinguished economist Jan Tinbergen, utilizes the concept of gravity to examine trade flows. Essentially, it predicts the magnitude of trade flows between two nations based on the size of their economies and the distance that separates them. This distance can be measured in kilometers, as well as in terms of economic, cultural, or historical factors. In the case of the Netherlands, for instance, nations that are both economically significant and geographically proximate to the Netherlands, such as Germany, will be crucial trading partners. This model can be employed to analyze two scenarios: (i) where there is no European Union and all current Member States engage in trade with one another based on the regulations of the World Trade Organization, and (ii) where the European Union has no Single Market, but does have free trade and an economic union.
During the previous century, the gravity model was primarily an empirical success; however, at the onset of the present century, Anderson and Van Wincoop (2003) developed a theoretical foundation. They introduced multilateral trade costs, which meant that trade is not solely dependent on the absolute distance separating two nations, but also on the relative distance to third countries. For instance, Australia and New Zealand will engage in relatively substantial trade with one another, even though the absolute distance between them is quite large, owing to their relative proximity to other countries. Conversely, the Netherlands and Belgium are close to each other, but because other nations, such as Germany, are also close, the Netherlands and Belgium will engage in relatively little trade with each other when compared to the volumes traded between Australia and New Zealand. The European Union has resulted in the economic distance between Member States becoming even smaller and in greater competition for Dutch exports to Belgium and vice versa, amongst other things.
Trade costs, such as non-tariff measures, can be viewed as obstacles that hinder trade between countries, thereby making it more expensive. Economic integration, such as the Free Trade Agreement, the Single Market, and the economic union, has played a key role in reducing trade costs for member states, which in turn has led to an increase in trade volume. This increase in trade has resulted in economic gains in terms of value-added and economic growth. The distance is illustrated through the infographic at the beginning of this publication.
The gravity model was employed in this article as it offers several advantages in analyzing the impact of economic integration on trade and GDP. Firstly, it is simple and straightforward compared to larger general equilibrium models like WorldScan. All parameters can be estimated based on the data, eliminating the need to rely on literature-based values. Secondly, the outcomes of the gravity model can be easily explained by economic theory, contrary to complex models that are often considered a black box. Lastly, the economic distance’s central role in the gravity model was leveraged to estimate the impact of the Single Market and the European Union on trade. However, the gravity model’s simplicity has some limitations, such as the difficulty in incorporating sectoral linkages, value chains, and dynamic trade effects, which may lead to underestimating the trade’s impact.
The scenario analyses were conducted in two steps, namely the estimation of the partial effect and the counterfactual analysis. In the first step, a gravity equation was used to estimate the individual impact of the three phases of the European Union on trade in goods and services, also known as the ceteris paribus effect. This involves assessing the impact on exports when joining the Single Market, for instance, while keeping everything else constant. Trade elasticities were estimated for the three economic integration phases to determine the percentage change in exports due to a percentage change in a type of trade cost. The estimated partial effects for goods and services are presented in Sections 3.1 and 3.2, with the inclusion of general equilibrium effects in the second step.
In the second stage, a counterfactual analysis was employed to determine the general equilibrium effects. This type of analysis compares the outcomes of a given intervention with those of a situation without the intervention. The purpose of this approach is to isolate the impact of the intervention from other factors, such as general economic growth. Two counterfactual scenarios were considered. The first scenario explored what would have happened if there had been no EU, and assumed that all three phases of economic integration had not occurred, and European countries traded with each other according to WTO regulations. Existing trade agreements between the current Member States and third countries remained in place. The second scenario examined the consequences of no European Single Market, assuming there was no Single Market between EU member states and EFTA countries, but the other two phases of economic integration remained in place.
In both scenarios, the general equilibrium effects were taken into account, meaning that changes in trade costs not only affected the countries directly involved but also had an indirect impact on third countries. The multilateral trade costs mentioned earlier were considered to account for this effect. By reversing the European Union or the Single Market, multilateral trade costs, trade prices, and income were influenced in all countries. Third countries that were relatively expensive before the EU was disbanded may experience trade diversion, leading to a situation where some of the trade between current EU Member States would shift to third countries such as the United States.
Data
In our study, we employed diverse trade data to estimate the partial effects and compute two scenarios. Specifically, we utilized gross trade flows obtained from various international input-output tables that span different time periods. These tables offer an advantage over other sources of trade data because they provide information not only on trade but also on domestic production consumed within a country, which is critical in our analysis to calculate the general equilibrium effects that are challenging to find in conjunction with international trade data.
For goods trade, we used a final data set that comprises 23 countries and 14 sectors across the 1965-2011 period, sourced from the Long-Term WOID database. This data set’s long time span enabled us to separately estimate the effects of the Single Market and the economic union. However, for services trade, we utilized the regular WIOD supplemented with Figaro data as the quality of the data on services trade before 2000 is suboptimal. The services data set covers 41 countries and 3 sectors from 2000-2017, and while we were unable to separately estimate the Single Market and economic union effects for services, the data set extends up to 2017, providing valuable insights.
In the second step of our analysis, the counterfactual analysis, we used the WIOD/Figaro database and conducted the analysis for 2017, the most recent year available. We had access to 22 sectors for goods, more than in the first step, as several sectors had been merged in the LTWIOD database. In the scenario analysis, we assigned the same elasticity of substitution to sectors that had been merged previously.
EU trade benefits: the partial impact
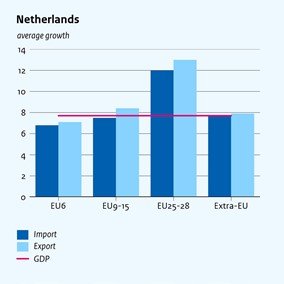
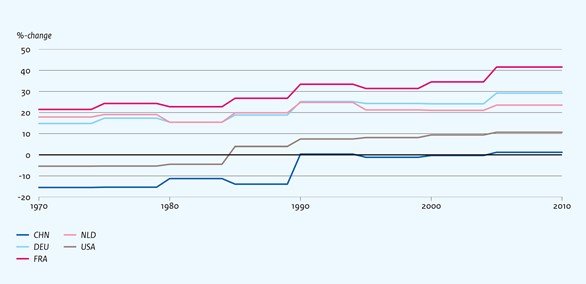
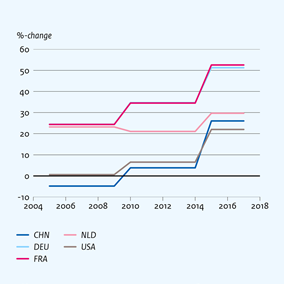
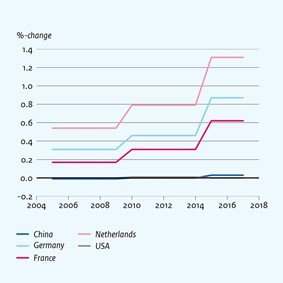
Both the internal and external trade in goods within the European Union (EU) has experienced significant growth over time, as illustrated in Figure 2. The growth since 1965 in the EU-6 and EU-9 – EU-15 Member States is shown, while for the new Member States, EU-25 – EU-28, data was only available since 2002. In all cases, the growth in trade has outpaced that of GDP (Figure 2). The figures for EU-6 – EU-15 depict long-term average growth, while for EU-25 – EU-28, the period is shorter, and growth rates vary significantly between decades. The reduction of trade barriers resulting from EU accession has contributed to increased trade between Member States. Additionally, the integration of emerging economies into the world market, accompanied by rapid economic growth, particularly in China, has further boosted both internal and external EU trade. Consequently, external EU trade has become increasingly important over time and has led to higher growth rates in recent decades. In the Netherlands, import and export growth has exceeded GDP growth in recent decades, as demonstrated in Figure 3. Notably, the growth level for imports and exports to the new Member States (EU-25 – EU-28) has been high.
Figure 2 illustrates the progression of both internal (left) and external (right) trade within the European Union, as well as the import and export of goods, and average GDP growth from the years 1965 to 2019.
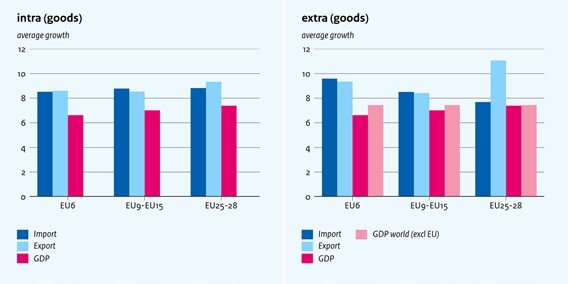
Figure 3 displays the progression of both internal and external imports and exports of goods within the European Union for the Netherlands, from the year 1965 to 2019.
The following section provides an estimation of the partial effects of the European Single Market and the European Union on trade in goods and services. The Single Market effect is an additional partial effect that adds to the impact from the other two phases of economic integration.
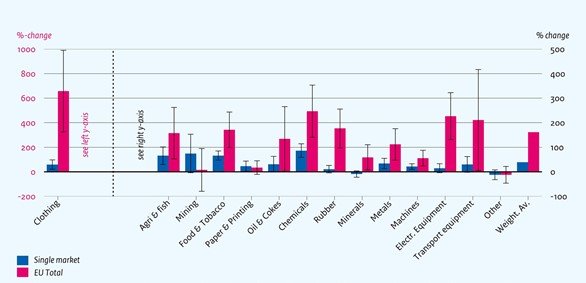
Goods
As shown in figure 4, the European Single Market and the European Union as a whole have had a positive impact on trade in all EU Member States. The impact is particularly significant in the clothing industry, while other sectors also show considerable positive effects. The European Union has led to a 177% increase in trade in processed foods, while the Single Market has resulted in a 66% increase in trade compared to non-EU countries. The EU effect is significant for almost all sectors, while the Single Market effect is significant in half of the sectors. The underlying estimates are shown in table 4 of the appendix.
Weighted averages indicate positive effects of both the Single Market and the European Union on all goods sectors. The Single Market contributes to 39% additional trade in goods between Member States compared to non-member countries, while the total EU effect results in 161% additional trade. The contributions of free trade, the Single Market, and the economic union are notably similar to the overall impact of the European Union.
Figure 4 illustrates that the European Union in its entirety along with its Single Market have yielded a favorable influence on the exchange of commodities across virtually all industries.
The effects of trade on certain sectors are significant, thus requiring a thorough examination of raw trade data to accurately identify these effects. In Figure 5, we observe the realized ratios in trade between EU-6 Member States and countries where at least one of the two is not an EU Member State. This analysis is conducted for all sectors combined as well as the two sectors that have the most significant estimated impact, namely the clothing and chemicals sectors.
Upon scrutinizing the raw trade data in Figure 5, we find that the estimated effects for the European Union as a whole are not unrealistic. For instance, the clothing industry has an average EU/non-EU ratio of approximately 3:1, meaning that the amount traded between EU Member States is three times that of non-EU Member States. Similarly, the ratio for chemicals is around 2:1. Both ratios are lower than the estimated effect and slightly beyond the confidence intervals of our estimates in Figure 4. This discrepancy could be due to the better isolation of the total EU effect in the estimates than in the raw data. The average EU to non-EU ratio for all sectors combined is just slightly higher than the average estimated effect shown in Figure 4, standing at 3:1. Interestingly, this ratio has witnessed a decline since the mid-1980s. This could be attributed to two possible causes, namely that the benefits of reducing trade costs wane as they approach zero, and that new EU Member States have caused a shift in trade from the EU-6 to these countries.
Figure 5 displays a comparison between EU-6 trade and non-EU trade for two sectors, over time
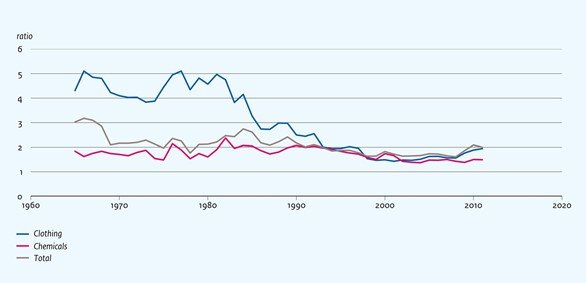
Figure 6 showcases a range of effects on exports that have occurred over a certain period of time.
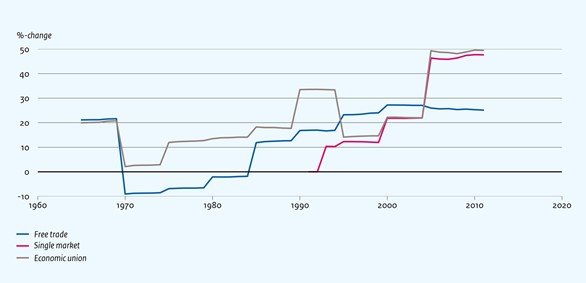
Over the course of time, the beneficial impact of the three phases of EU integration has increased significantly. While Figure 4 displays percentages averaged over time, Figure 6 depicts how the weighted average across the sectors in the three phases evolved with time. The arrival of the Single Market in the early 1990s made it possible to estimate its effect. Subsequently, all three effects have been observed to grow in a clear manner, particularly from the 1980s onwards. This is perhaps owing to the fact that the number of Member States has steadily increased since the mid-1970s, and EU integration has consequently encompassed an increasingly large trade volume. These expansions appear to outweigh the diminishing advantages of reducing trade costs. The free trade phase had a negative impact in the 1970s, but a recovery ensued around the time of the admission of the United Kingdom, Denmark, and Ireland. It is plausible that the time-dependent parameters of free trade, as well as those of the economic union, partially absorbed the turbulence surrounding fixed exchange rate systems in that era, including the collapse of the Bretton Woods system in the early 1970s.
Services
For the domain of services, we have restricted the data we employed to appraise the impact on trade to the era starting from 2000. Nevertheless, this implies that we were not able to differentiate the influence of the Single Market phase from that of the economic union, since both stages began prior to 2000 and, thus, cannot be distinguished from each other.
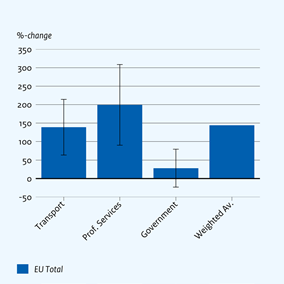
Regarding services, the collective EU impact is affirmative for all sectors, with a higher magnitude of trade – weighted average across sectors of 144% – amid Member States than amid nations outside the European Union (Figure 7). Professional services and, to a smaller extent, transportation and tourism avail the most from the European Union. Conversely, trade-in public services benefits far less. This is comprehensible as public services are commonly only accessible to the national population. Table 5 in the appendix displays the fundamental estimations.
The collective force of the European Union has yielded a favorable influence on the exchange of services across all industries. Behold Figure 7.
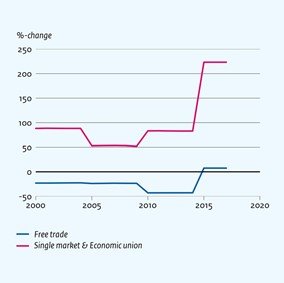
Since 2000, the impact of free trade and the integration of the Single Market and economic union has remained relatively stable for services, but there has been a recent peak. Figure 8 illustrates that the free trade effect is generally negative, while the combined effect of the Single Market and economic union is positive. In the case of services, import tariffs are not the primary obstacle, rather they are often limited by NTMs. Consequently, the trade in services does not generally benefit from free trade, but rather from a Single Market and economic union. The reason for this is that a free trade agreement merely eliminates or reduces tariffs, while a Single Market and economic union primarily removes or standardizes NTMs within the Single Market.
The graph presented as Figure 8 displays the gradual increase in the weighted average impact on exports for all sectors of services over a period of time presented as a percentage.
The examination of the benefits of EU trade by utilizing the general equilibrium analysis provided by the gravity model
In doing so, the analysis employs counterfactuals to showcase the gains the Netherlands and other countries have experienced as a result of the European Union and the European Single Market. The three phases of the EU – free trade, Single Market, and economic union – are once again categorized and used for analysis, as previously described. The following results indicate, unless stated otherwise, the cumulative general equilibrium impact of all three phases of the EU combined.
Figure 9 presents the changes in the export of goods and services (in %) which demonstrate that EU member states have reaped the benefits brought forth by the European Union.
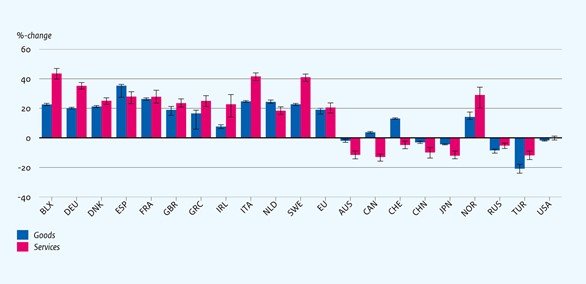
The export of Dutch goods within the European Union is almost 25% higher than outside the EU, and for services, this figure is almost 20%. Figure 9 highlights the impact of the European Union on the exports of different countries across the three phases. The differences in the impact are significant, with EU Member States experiencing a rise in exports of goods and services between 20% and 40% due to the existence of the EU. This includes Norway, which is closely connected to the EU even though it is an external participant in the Single Market.
However, the situation changes for countries outside the European Union. While the impact on the United States remains limited, countries like Russia and Australia are exporting fewer goods and services due to trade diversion. This means that when EU Member States trade more with each other, the trade with other countries subsequently decreases. Turkey is not a part of the European Single Market but has a customs union with the European Union. The trade levels with Turkey would be higher if there were no EU, as EU Member States currently import less from Turkey and more from each other.
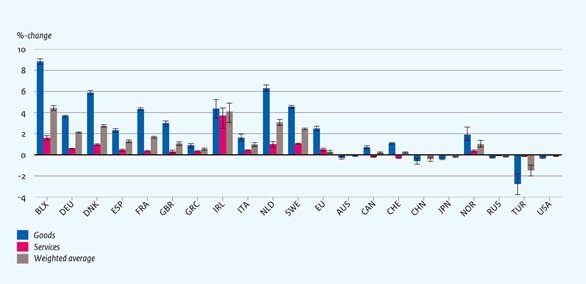
Every country does not have the same trade revenues, and international trade’s significance varies across nations. Figure 10 depicts the impact of the EU on value added in the goods and services sectors, as well as a weighted average that indicates the GDP impact. In the Netherlands, the GDP effect is 3.1%. Smaller, open EU Member States such as Belgium, Luxembourg, Ireland, Denmark, and the Netherlands benefit the most from the EU as they rely heavily on international trade, making their trade revenues relatively significant. The value-added profits related to goods are more significant than those related to services for most countries. This is because many services are not traded internationally, and a relatively large change in services exports can have a limited impact on value added as exports only account for a small share of all services produced.
Smaller open EU Member States are particularly advantaged by the European Union, as demonstrated by the change in added value represented in Figure 10.
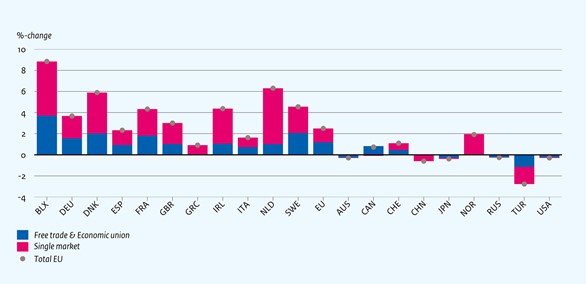
Between 50% and 80% of the total effect that the European Union (EU) has on goods trade can be attributed to the European Single Market. With respect to this matter, it can be noted that the impact of goods trade was distinguished between that of the Single Market and of other EU components such as free trade. Interestingly enough, according to Figure 11, almost 80% of the effect of the EU on goods trade in terms of added value can be explained by the Single Market, particularly in the Netherlands. The Netherlands is an exception in this regard, since for most EU Member States, the Single-Market effect makes up about half of the total EU effect. This implies that the Single Market is of particular importance to the Netherlands.
For non-European Union (EU) countries, the phenomenon of trade diversion may result in reduced value added. It is interesting to note that Turkey and China, in particular, have lower added value due to the European Union. Conversely, Canada, Switzerland, and Norway benefit from the European Union. This is because these countries have strong ties with the EU and, therefore, benefit from additional trade and added value.
It can be inferred that the distinction between the European Union and the European Single Market cannot be made for services. This is because the effects of services can only be estimated from the year 2000 onwards, as previously discussed.
Figure 11 depicts that the European Single Market encompasses a substantial proportion of the overall impact of the European Union on trade in goods.
Over time, the European Union as a whole has had a positive impact on the trade of goods and services, as evidenced by the figures based on average EU effects between 1965 and 2011 (2000-2017 for services). By analyzing the effect over various time periods and utilizing trade elasticities estimated per five years, we observe a trend of increasing value of the European Union as a whole, potentially due to deeper economic integration and expansion. For Member States, the value of the European Union has been significant from the outset. However, it is noteworthy that until the early 1990s, countries outside the European Union experienced decreased exports as a result of the EU, likely due to trade diversion as EU member states traded more with each other and less with non-EU countries. As international integration increased, the EU has also had a positive impact on exports of non-EU countries.
Figure 12 shows the change in goods exports from the European Union.
The graph depicted in Figure 13 showcases the evolution of services exports from the European Union.
The European Union was instrumental in contributing to a surge in value added in EU Member States, particularly in the Netherlands. Although the Netherlands had an average increase in goods and services exports compared to other Member States (as evidenced by Figures 12 and 13), Figures 14 and 15 show a significant increase in the EU effect for value added over time. This underscores the importance of international trade for the Netherlands and its relatively strong integration in the European Union. Compared to other EU Member States, the Netherlands is distinguished by exporting a sizable portion of its domestic production. Consequently, the benefits for the Netherlands have grown considerably.
Figure 14 represent the Change in added value due to goods exports from the European Union.
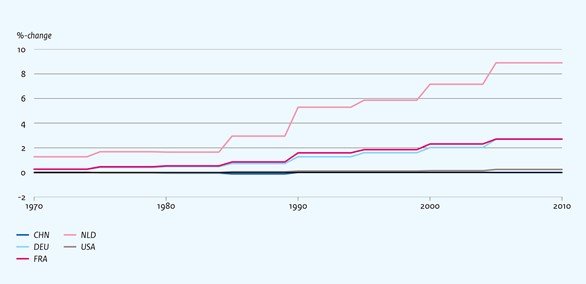
Figure 15 displays the change in added value due to services exports from the European Union.
Additional EU impact
This article focuses on the identification of trade benefits, but the influence of the European Union goes far beyond that. The foundational institutions of the European Union, such as the European Parliament and the European Court of Justice, are funded by the EU, in addition to the financing of a number of large programs. For example, it provides funding for cross-border cooperation among regional and local authorities of EU Member States, research partnerships, and the European Fund for Strategic Investments (EFSI). The Common Agricultural Policy (CAP) is one of the largest programs. All member states contribute financially to the funding of these institutions and programs. In 2019, the Netherlands contributed approximately net 0.67% of its GDP to the European Union, which already includes the amount received by the Netherlands. This includes paid customs duties according to the Dutch definition. However, according to the European Commission, the net payment is half of that, which is 0.35% of GDP. If the Netherlands were not a member of the European Union, part of these customs duties would no longer be payable in the Netherlands. The payment is merely an expenditure and does not indicate its effect on economic growth. On one hand, the amount could be spent domestically, which could stimulate GDP growth, but on the other hand, it also contributes to the economic growth of the new Member States, particularly the net recipients, which indirectly has a positive effect on Dutch trade.
In addition to trade diversion, the European Union’s regulation also has an impact on third countries through the so-called Brussels effect. The European Union’s market size and economic significance imply that companies elsewhere also adapt a significant share of their products to meet EU standards. As a result, producing goods that do not comply with these standards becomes less profitable or technically infeasible. Therefore, the EU standard is becoming the standard for the entire product range, even outside the European Union. Other regulations, such as those on data, also affect both EU companies and those outside the European Union.
Migration
The open borders and free movement of people in the European Union have led to increased migration flows among Member States, allowing EU citizens to live, work, or study in different countries. A recent study by Rojas and Bollen found that when a Member State permits the free movement of persons from another Member State, migrant numbers increase by an average of 28%. However, migration has socio-cultural aspects that go beyond the mere consideration of immigrants as a source of labor inputs. This was highlighted by migration economist Borjas in 2018, who warned against viewing immigrants in a narrow perspective.
One of the most widely researched aspects of migration is its impact on labor market displacement. In the Netherlands, there are indications of displacement at the lower end of the labor market, particularly if a migrant has competing skills. However, if a migrant has complementary skills, this may not lead to a reduction in local employment or wages. A recent report by SCP and CPB interviewed Dutch citizens aged 16–67 about this subject, indicating that they largely perceived reduced labor market opportunities as a result of migration. SCP and CPB also conducted their own analyses and found only a few indications of displacement at the lower end of the labor market. The skills required for those jobs are probably easier to acquire and less specialized. Nevertheless, the perceived displacement was found to be higher than the actual measurable displacement.
In the long run, there are dynamic repercussions of migration that extend to other sectors of the economy. While most scholarly studies indicate that there are no displacement effects, meaning that the influx of migrants does not have a negative long-term impact on employment or wages of the original residents and may even have a positive impact, the magnitude of these effects is contingent upon the economic situation. During a recession, labor demand may respond more slowly than it would during periods of economic growth. A study of intra-European migration from 2000 to 2013 reveals that migration flows increase as employment disparities widen. For instance, during the 2008 economic crisis, more people migrated from southern countries, which were hardest hit, to countries such as Denmark and the United Kingdom, which were least affected. This may have the additional effect of hastening the recovery of European countries that are lagging behind economically. Migration within the European Union will boost economic activity for the entire region, particularly when migrants from Member States with high unemployment are able to work elsewhere within the European Union. Nevertheless, the precise distribution of the benefits of additional economic activity among EU Member States is difficult to gauge and depends on factors such as migrant integration and development in the recipient country, return migration, and remittance. Many migrants eventually return to their homeland, as per a report by the Netherlands Scientific Council for Government Policy (WRR), which indicates that a significant proportion of Polish migrant workers in the Netherlands return to Poland once they have accumulated adequate resources, or travel back and forth on a regular basis based on the employment situation.
Van de Beek and colleagues (2021) have discovered that the Dutch Government budget has experienced favorable outcomes in relation to EU immigration. The authors arrived at this conclusion by deducting the total costs – which include direct expenses such as taxes, state pensions, allowances, and welfare benefit payments as well as indirect expenses such as infrastructure and public administration costs – from the direct benefits that migrants pay in payroll taxes, premiums, and VAT. Their calculations reveal that between 1995 and 2009, the first and second generations of EU immigrants resulted in a positive balance of 25 billion for the Netherlands. However, in recent years, the costs and benefits of EU migrants have become more balanced. It is important to note that this positive balance does not refer to the GDP effect but instead signifies that migrants from Europe have paid more in comparison to the Dutch Government’s direct and indirect costs. The calculation, therefore, does not include the economic influence of migrants on the Netherlands’ GDP. Lastly, if we consider a broad welfare perspective, we must also consider factors like spatial scarcity in the Netherlands and the potential brain drain from migration countries.
The partial impact of the euro on exports
The introduction of the euro in 1999 was primarily driven by the economic benefits it would bring, particularly in reducing trade costs. By getting rid of exchange rates, importers could avoid paying conversion fees while exporters and importers would face less risk of sudden currency depreciation or appreciation. Studies have been conducted to analyze the impact of the euro on trade, with varying estimates. A meta-analysis of 45 scientific articles found that the average estimated partial impact of the euro on trade is around 12%. Our own gravity model estimates the effect of the euro on goods and services, with smaller effects found for goods compared to services. The impact of the euro is larger for the Netherlands due to the country’s status as a trading nation, particularly for services. However, there is a large variation between sectors. Overall, the estimated euro effect is very small when compared to the total EU effect.
Table 2 represents the average partial impact of the euro on exports, across sectors
| Eurozone as a whole (%) | Eurozone excl. NL (%) | Netherlands (%) | ||
| Goods | Average | 7.2 | 4.0 | 11.9 |
| Weighted average | 3.6 | 2.2 | 6.4 | |
| Standard deviation | 19.3 | 13.9 | 33.1 | |
| Services | Average | 16.4 | 14.4 | 37.2 |
| Weighted average | 21.9 | 19.7 | 45.5 | |
| Standard deviation | 15.8 | 15.5 | 20.8 | |
Foreign direct investments
Numerous investigations have demonstrated that the membership of the EU amplifies the inflow of foreign direct investments (FDI) originating from multinational organizations that expand their business ventures beyond borders. FDI is usually propelled by three motives: market expansion, the procurement of more efficient or economical production factors, and the acquisition of knowledge and brand names. These reasons are all linked to the increase in FDI flows within the EU, which has led to two primary outcomes.
Firstly, due to the escalated relative customs rights to trade outside the EU, third-country enterprises’ benefits have changed from exports to direct investments. These businesses are broadening their markets by investing in the production capabilities within the EU. Since the European Single Market is of significant size, this alternative has become increasingly lucrative in comparison to exporting to the EU. This is evidenced by the measured surge in FDI after the announcement of future EU membership.
Secondly, FDI flows between EU Member States have increased as production costs can vary significantly between them. Consequently, firms can reduce costs by relocating production to other EU Member States. According to Bruno et al. (2021), the Single Market plays a pivotal role in this regard. The extensive integration of the Single Market allows companies to allocate production across various Member States to maximize the comparative advantages of each Member State. For instance, some countries may have less expensive labor, while others may have greater research capabilities.
The impact of augmented FDI flows on GDP growth is most likely positive, as long as domestic investments are not crowded out. Total investment will rise under higher FDI inflows, which can create more jobs, thereby boosting the economy. However, these foreign-owned companies, which have been established through foreign direct investments, imply that profits are likely to go to the foreign owners, and the amount of added value staying in the Netherlands is uncertain. Lastly, some of the investments may be linked to the multinationals’ tax networks. For example, the Netherlands plays a part in international constructions where these companies try to minimize tax payments.
Conclusion
This article reveals that the European Union has fostered increased trade among its Member States, leading to economic growth in the Netherlands and most EU Member States. The Netherlands stands out as one of the countries that benefits the most from EU trade, with trade benefits equivalent to 3.1% of its GDP. However, only a few other countries, such as Ireland, Belgium-Luxembourg, and some recent Central and Eastern European entrants, benefit more on average from EU trade.
Outside the European Union, the situation is different due to trade diversion. EU membership results in more trade among Member States and less with countries outside the EU, which often causes losses for these third countries. However, this does not apply to countries that are deeply integrated in the EU, such as Norway. Although not a member, Norway enjoys substantial EU-related trade benefits, which could be even greater if it were a member. The disadvantage of not being a member is that these countries have no influence on new regulations concerning the European Single Market, despite being fairly integrated.
The Netherlands is particularly privileged by the Single Market, which accounts for over 80% of the total impact on trade in goods. We classify the EU’s impact into three stages of integration: free trade, the Single Market, and the economic union, which have different levels of importance and impact on countries. While the Netherlands benefits mainly from the Single Market, France and Germany benefit relatively more from the other two stages of integration.
The contributions of the Single Market and full economic union exhibit varying degrees of similarity across different sectors, although their combined contribution surpasses that of free trade on average. Notably, raw material-processing industries like rubber and metal benefit significantly more from free trade. In contrast, the disparity between the phases becomes more pronounced in the trade of services, where free trade offers little to no impact. However, further integration phases more than make up for this deficiency, as they prioritize facilitating the exchange of services.
Over time, the advantages of the European Union in trade, both for goods and services, continue to expand despite diminishing marginal benefits from reducing trade costs. Notably, the growing size of the European Union plays a key role in this trend, which also applies to the three phases of economic integration.
This article exclusively focuses on quantifying the trade benefits of the European Union and the Single Market, up to 2017. Although other aspects of the European Union, such as migration, foreign direct investment, and financial integration, may generate benefits, their exact impact remains uncertain, especially in relation to trade. Additionally, recent developments, such as Brexit, could not be incorporated into the model due to limited data availability. Brexit is expected to have a minor negative effect on the Netherlands’ total EU benefits, as the United Kingdom was a significant trading partner, and the EU has become smaller as a result.
It is probable that our assessment of the EU’s influence is a cautious approximation. The CPB gravity model currently does not employ the concept of sectoral linkages, which would permit the inclusion of interactions between different industries. Although this is a relatively new concept in literature, the available findings indicate that incorporating sectoral linkages into the model can enhance the projected trade benefits. Furthermore, the gravity model does not consider the potential dynamic impact on economic growth that could result from increased productivity related to trade.
References